In Sacramento, California, as the city grows and more cars hit the road, there’s been a worrying rise in car crashes. This report takes a close look at the yearly numbers, showing how often and how serious these crashes are.
It points out the main reasons they happen, like drivers not paying attention or bad weather. The report also points out the most dangerous spots to drive in Sacramento, so drivers know where they need to be extra careful.
It looks at who gets hurt the most in these crashes and talks about what kind of safety programs are in place to make the roads safer. The report checks if these safety efforts are actually working to cut down on crashes.
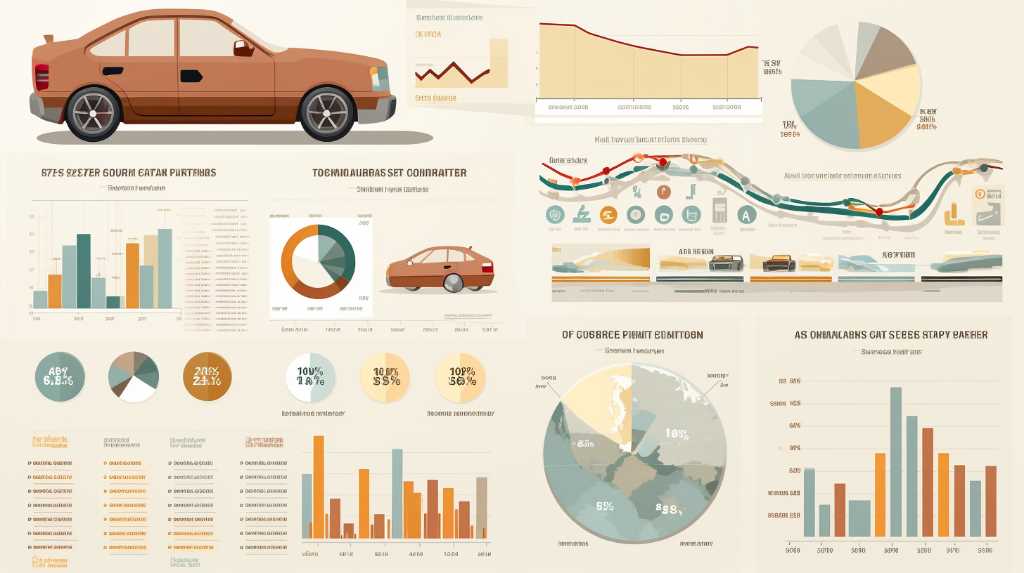
Annual Collision Figures
Every year, Sacramento sees a lot of car crashes, with thousands affecting drivers, passengers, and people walking. Recent information from the California Highway Patrol shows that this problem isn’t going away.
This data is important because it tells us which parts of Sacramento have the most accidents. Knowing where these accident hotspots are helps the police and city officials work on making those areas safer.
This information is very useful for people who make laws and those who want to make our roads safer. It helps them come up with plans to prevent car crashes.
The number of crashes each year shows us how safe, or not safe, Sacramento’s roads are for everyone.
Common Causes Analyzed
Analysis of traffic data has identified distracted driving, speeding, and impaired driving as the predominant causes of vehicular accidents in Sacramento.
Distracted driving, often manifested through the use of mobile devices, contributes significantly to driver inattention, resulting in a marked inability to respond to road conditions.
Speeding, exceeding posted limits or driving too fast for conditions, is correlated with both the frequency and severity of accidents, diminishing reaction time and increasing stopping distances.
Impaired driving, primarily due to alcohol or drug consumption, severely hampers judgment, coordination, and reaction times, elevating the risk of collisions.
These factors, supported by statistical correlations, underscore the critical need for targeted enforcement and public awareness campaigns to mitigate the incidence of traffic-related fatalities and injuries.
Accident Hotspots Revealed
The identification of specific high-risk locations within Sacramento has highlighted several accident hotspots where traffic incidents occur with alarming regularity. Data analysis reveals that intersections with high vehicle throughput, such as the convergence of I-5 and Highway 50, are particularly prone to collisions.
The empirical evidence suggests a concentration of accidents along the I-80 corridor, with an exceptionally high incidence rate near the Truxel Road exit.
Further scrutiny indicates that the amalgamation of heavy traffic, complex road layouts, and frequent stop-and-go conditions contribute to these areas’ perilous reputation.
Efforts to mitigate risks include increased traffic signal visibility, enforcement of speed regulations, and the implementation of advanced warning systems. These measures aim to enhance driver awareness and response times, thereby reducing accident occurrence.
Demographic Impact Overview
In Sacramento, young drivers between 18 and 25 years old get into more car crashes than other age groups. This might be because they tend to take more risks and don’t have as much experience driving. Also, within this age group, men are more likely to be in accidents than women.
Money matters too. Areas with less wealth see more car accidents. This could be because the roads aren’t as well kept, there isn’t enough street lighting, or the cars are older and not as safe. Knowing this, it’s clear we need to focus on making roads safer in these neighborhoods, maybe through education campaigns about driving safely or by fixing up the streets and lights.
Safety Initiatives and Effects
Sacramento has taken big steps to make the roads safer and cut down on car crashes, especially where they happen most and in poorer neighborhoods. They’ve made it easier for people to walk safely, changed dangerous crossroads, and taught people more about staying safe on the road.
The numbers show that these changes are working—car crashes at updated traffic lights went down by 15%. Plus, in areas where they talked a lot about safety, more people started using seat belts and making sure kids are in car seats.
This proves that Sacramento’s careful and specific way of improving road safety is really making people safer from car accidents.
Conclusion
To wrap things up, looking closely at car crash stats in Sacramento, California, we see it’s a complex problem with many different causes.
Every year, the number of crashes tells us how big the issue is. By figuring out the main reasons for these crashes and where they happen most, we can come up with specific ways to fix the problem.
It’s important to know which groups of people get into accidents more often, so we can help them stay safe. Starting safety programs looks like it’s working to lower the danger, but we have to keep checking and tweaking these plans to make our roads safer.